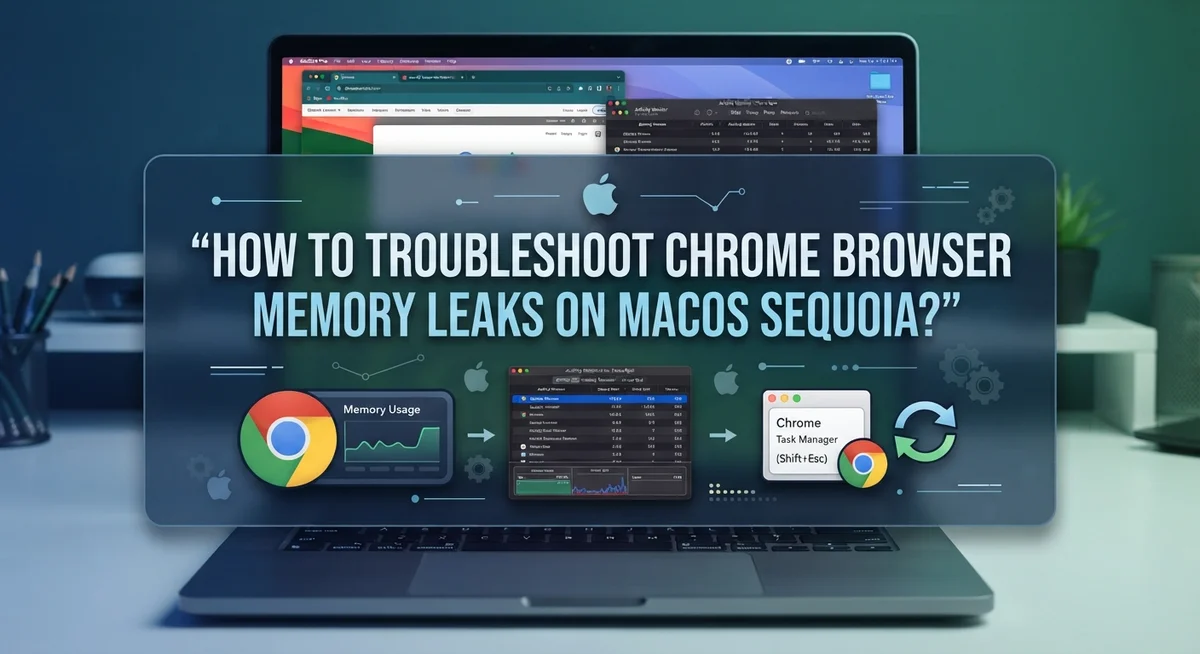
How To Troubleshoot Chrome Browser Memory Leaks On macOS Sequoia?
Does your Chrome browser slow down after a few hours on macOS Sequoia? You are not alone. Many Mac users notice their fans spinning up and their system dragging, even with just a few tabs open.
This usually points to a memory leak. Chrome starts eating up more RAM than it should, and your whole Mac feels sluggish.
The tricky part is figuring out where the problem actually starts. Sometimes Chrome itself is the culprit. Other times, macOS Sequoia’s own windowserver process causes the slowdown, and Chrome just gets the blame.
This guide walks you through the exact steps to find the real source. You will learn how to use Chrome DevTools to spot memory leak patterns. We will also show you how to enable Memory Saver, a built in Chrome feature made to fight excessive memory use.
In a Nutshell
- Update Chrome first. The latest version includes a Memory Saver feature. This feature helps reduce leaks automatically.
- Open Chrome DevTools to check memory patterns. The memory profiler shows exactly where memory piles up. This helps you spot bloat versus a true leak.
- Check Activity Monitor for system wide clues. Watch the windowserver process closely. It is a known culprit on newer macOS versions.
- Separate Chrome issues from macOS issues. Sometimes the browser gets blamed unfairly. The real problem might sit inside Sequoia itself.
- Turn on Memory Saver inside Chrome settings. Go to Performance settings to enable it. This single step often solves smaller leaks fast.
- Watch garbage collection cycles too. Frequent cycles can signal deeper bloat problems. DevTools makes these cycles easy to track.
Understanding Chrome Memory Leaks vs Memory Bloat
A memory leak means your browser holds onto data it no longer needs. This unused data stays in your RAM and never gets released back to the system. Over time, Chrome consumes more and more memory until your Mac slows down significantly.
Memory bloat is different. It happens when Chrome simply uses too much memory at once, even if it’s all being used actively. Your browser might load many tabs, extensions, or large web pages. This creates high memory usage without necessarily being a leak.
The key difference matters for troubleshooting. A leak gets worse over time even when you do nothing. Bloat stays roughly the same or improves when you close tabs.
Chrome on macOS Sequoia experiences both issues. Garbage collection is the process where Chrome cleans up old data. Sometimes this process fails or runs too slowly. When garbage collection breaks down, memory piles up and never gets freed.
You need to identify which problem you have. If Chrome uses 2GB of RAM but you only have 10 tabs open, that’s bloat. If Chrome uses 100MB with 2 tabs today and 800MB with the same 2 tabs next week, that’s a leak.
System level processes complicate this further. The windowserver process on macOS Sequoia can cause memory issues that look like Chrome problems. Your Mac might be the culprit, not your browser.
Understanding these differences helps you fix the right thing. A bloat problem needs different solutions than a leak. Misdiagnosing wastes your time and leaves the real problem unsolved.
Signs Your Chrome Browser Is Leaking Memory on macOS Sequoia
Your Chrome browser shows specific warning signs when memory leaks develop on macOS Sequoia. Recognizing these signs helps you act before performance crashes completely.
The first sign is slowness that builds over time. Chrome runs fine when you open it. After two or three hours, tabs load slowly. Videos stutter. Scrolling becomes choppy. This gradual decline points to memory accumulation rather than a one time glitch.
High RAM usage is the next clue. Open Activity Monitor on your Mac. Search for Google Chrome in the list. Check how much memory it uses. If Chrome consumes 3GB or more with only 10 to 15 tabs open, something is wrong. Your system should not require that much space for basic browsing.
Fan noise increases noticeably. Your Mac’s cooling fan kicks in more often. The fan runs even when you are not doing heavy tasks. This happens because Chrome forces your processor to work harder while managing bloated memory.
Browser crashes happen more frequently. Chrome quits unexpectedly. Tabs freeze solid. You see the spinning wheel constantly. These crashes often signal that Chrome ran out of available memory to use.
Unresponsive interface is another warning. Clicking buttons takes several seconds to register. Typing in search boxes lags behind your keystrokes. The entire browser feels sluggish and delayed.
Tab switching becomes slow. Moving between tabs takes noticeable time. This suggests Chrome struggles to access data stored in memory efficiently.
System wide slowness develops. Your entire Mac feels sluggish, not just Chrome. Other apps respond slowly. This indicates Chrome memory issues are affecting your whole system performance. These signs together confirm a memory leak problem needs immediate attention.
Using Chrome DevTools to Diagnose Memory Issues
Chrome DevTools gives you a direct window into what’s happening inside your browser’s memory. This is where you find the actual proof of a leak rather than just guessing.
Open Chrome DevTools by pressing Command+Option+I on your Mac. Navigate to the Memory tab. You’ll see several options here. Click on “Heap snapshots” to take a picture of your browser’s current memory state.
Take your first snapshot right now. Then wait five minutes while you use Chrome normally. Open a few tabs, scroll around, do typical browsing. After five minutes, take a second snapshot. Compare the two snapshots side by side.
Look for objects that grew between snapshots. If you see the same objects increasing in number each time, that’s a leak indicator. The DevTools will show you exactly which scripts or extensions are holding onto memory.
Pay attention to the “Detached DOM nodes” section. These are page elements that should have been deleted but weren’t. A high number here often means a memory leak exists.
You can also use the Performance tab to watch memory over time. Click the record button, then use Chrome for several minutes. Stop recording and look at the memory graph. If the line climbs steadily upward without dropping back down, you’ve found your leak.
Switch to the Allocation timeline view for another perspective. This shows you exactly when memory spikes happen. Notice if spikes occur when you visit certain websites or use specific extensions.
Document what you find. Write down which tabs, websites, or extensions appear in the memory snapshots. This information helps you narrow down the source and decide your next troubleshooting step.
Monitoring RAM Usage and the WindowServer Process via Activity Monitor
Activity Monitor is your window into what’s really happening with your Mac’s memory. Open it by pressing Command+Space, typing “Activity Monitor,” then pressing Enter.
Once Activity Monitor opens, click the Memory tab at the top. You’ll see a list of running processes with their memory usage displayed in the “Memory” column. Look for Chrome and note how much RAM it’s using right now.
The WindowServer process deserves special attention. This system process manages your display and graphics. On macOS Sequoia, WindowServer sometimes consumes excessive memory, which can make Chrome appear to leak when it’s actually a system issue. Find WindowServer in the list and check its memory usage.
Scroll through the entire process list and note which apps use the most RAM. This helps you understand if Chrome is the real culprit or if other processes are competing for memory resources.
Watch these numbers change over time. Leave Activity Monitor open while you use Chrome normally. After 30 minutes, check the memory column again. If Chrome’s memory keeps climbing even though you haven’t opened new tabs, you likely have a leak.
Click the Memory tab header twice to sort by memory usage in descending order. This puts the biggest memory consumers at the top, making them easy to spot.
Pay attention to the “Real Memory” column, not just the total. Real Memory shows actual RAM being used, while other columns show different measurements that can be misleading.
Take screenshots of Activity Monitor at different times. Compare these snapshots to track memory growth patterns. This documentation helps you identify whether the problem is constant or happens only during specific activities.
Enabling Chrome’s Memory Saver and Performance Settings
Chrome includes built in settings that help manage memory usage on macOS Sequoia. Accessing these features takes just a few clicks and can make a real difference in your browser’s performance.
Start by opening Chrome and clicking the three vertical dots in the top right corner. Select “Settings” from the dropdown menu. Look for “Performance” in the left sidebar. This section contains the tools you need.
Memory Saver is the key feature here. Toggle it on to let Chrome reduce memory usage when you’re not actively using tabs. This feature works automatically in the background. Chrome will unload tabs you haven’t viewed recently, freeing up RAM instantly.
You can customize how aggressive Memory Saver becomes. Click on the Memory Saver settings to choose when Chrome should start reducing memory. You can set it to activate when your device is low on memory or always keep it on. Most users benefit from the “Standard” setting.
Efficiency mode is another important option. Enable this to limit how much CPU power Chrome uses when you’re not interacting with it. This reduces heat generation and fan noise on your Mac.
The Performance section also shows you which sites use the most memory. Scroll down to see this list. Sites that drain significant resources appear here. You can disable notifications or autoplay for heavy sites to reduce their memory impact.
After enabling these settings, your Chrome browser should run smoother. Memory usage drops noticeably within hours of turning Memory Saver on. Monitor your Activity Monitor to confirm the improvements you’re seeing. These settings work best when combined with regular updates to keep Chrome current.
Step-by-Step Troubleshooting Workflow for Persistent Leaks
Start by opening Chrome and taking a memory snapshot using DevTools. Press Command+Option+I on your Mac to launch DevTools. Click the Memory tab and select “Take heap snapshot” to capture your current memory state.
Let the browser run normally for 5 to 10 minutes. Open several tabs and visit websites you use daily. This recreates your typical browsing pattern and helps identify real leak sources.
Take a second snapshot after this time period. Compare both snapshots in DevTools. Look for objects that increased significantly between the two captures. Pay special attention to “Detached DOM nodes” as these often indicate memory that Chrome failed to release.
Open Activity Monitor on your Mac while Chrome runs. Click the Memory tab and sort by “Real Memory” in descending order. Watch how Chrome’s memory usage changes over time. Note if the number keeps climbing even when you’re not actively using the browser.
Check the WindowServer process in Activity Monitor. This system process sometimes contributes to memory issues on macOS Sequoia. If WindowServer shows extremely high memory usage, this may be a system level issue rather than a Chrome specific problem.
Enable Chrome’s Memory Saver feature immediately. Open Chrome settings, navigate to Performance, and toggle Memory Saver on. This feature automatically reduces memory consumption when tabs are inactive.
Use the Performance tab in Chrome settings to identify which websites consume the most memory. Some sites are simply more memory intensive than others. You can decide whether to limit your time on these sites or accept higher memory usage.
Document your findings from both DevTools and Activity Monitor. This information helps you determine whether the leak is Chrome related or stems from your macOS system itself.
Common Mistakes That Delay Fixing Memory Leaks
Many people make mistakes that slow down their memory leak fixes. Understanding these errors helps you solve problems faster.
Ignoring the WindowServer process is a major mistake. This system process manages your display and graphics on macOS Sequoia. Many users focus only on Chrome itself and miss that WindowServer could be the real culprit. Check Activity Monitor and look at WindowServer’s memory usage before blaming Chrome entirely.
Not updating Chrome regularly delays your fixes significantly. Older Chrome versions lack the Memory Saver feature that addresses leaks directly. You should update Chrome to the latest version first. This simple step often resolves memory problems without extra troubleshooting.
Confusing Chrome leaks with macOS Sequoia issues wastes your time. A memory leak might come from your operating system, not the browser. Take time to identify the actual source. Use both DevTools and Activity Monitor to narrow down the problem.
Skipping the Performance tab in Chrome settings means you miss critical information. This tab shows which websites consume the most memory. You might discover that one problematic website causes all your issues. Identifying the specific site lets you take targeted action.
Enabling Memory Saver but forgetting to restart Chrome reduces effectiveness. The feature works best after a fresh browser restart. Close Chrome completely and reopen it after turning on Memory Saver.
Not monitoring changes over time prevents you from seeing patterns. Leave Activity Monitor open while using Chrome normally. Watch memory usage climb or stay stable. This real world observation reveals whether your fixes actually work.
When the Problem Is macOS Sequoia, Not Chrome
Sometimes Chrome runs fine, but your Mac slows down anyway. This means the problem might be macOS Sequoia itself, not Chrome. You need to figure out which one is actually causing the issue.
Start by checking the WindowServer process. Open Activity Monitor on your Mac. Click the Memory tab. Look for WindowServer in the list. If this process uses more than 1 GB of RAM, your Mac’s system is the culprit, not Chrome. WindowServer handles all graphics and display tasks on macOS. Recent versions of Sequoia have shown high memory usage from this process.
Next, restart your Mac completely. This clears temporary memory issues that macOS creates. After restart, open Activity Monitor again and check WindowServer’s memory use. If it drops significantly, your issue was a macOS glitch. If it stays high, Sequoia has a deeper problem.
You can also check your Mac’s overall system health. Go to System Settings. Click General, then About. Note your total available memory. If your Mac has less than 4 GB free RAM, the system itself struggles, not just Chrome.
Update macOS Sequoia to the latest version. Apple releases updates that fix memory problems. Go to System Settings, then General, then Software Update. Install any available updates.
If WindowServer still uses excessive memory after updating, your Mac needs professional help. The issue lives in your operating system, not your browser. Contact Apple Support or visit an Apple Store. They can run diagnostics to find system level problems.
Final Thoughts
Chrome memory leaks on macOS Sequoia can feel frustrating. But you now have a clear path to fix them. Small, steady checks make a big difference over time.
Remember that both Chrome and macOS play a role in memory problems. You cannot fix one without checking the other. This dual approach saves you time and stress.
Regular maintenance matters more than one-time fixes. Check your memory usage weekly. This habit catches problems before they slow down your entire system.
DevTools and Activity Monitor work together as your best tools. Use them side by side whenever something feels off. This combination gives you a full picture of what’s happening.
Keep Chrome and macOS updated at all times. Software updates often include fixes you cannot get any other way. Skipping updates means you miss important improvements.
Memory Saver is a simple feature with big benefits. Turn it on and let it work in the background. It reduces strain without any extra effort from you.
Patience helps during this process. Some leaks take time to show clear patterns. Give your system a few days before you draw final conclusions.
If problems persist after trying every step, professional help is worth considering. Some issues go deeper than user level fixes. A technician can spot things that Activity Monitor cannot show.
Your Mac and Chrome should work well together. With the right checks in place, you can keep memory leaks under control. Stay consistent, stay curious, and your system will thank you for it.
Frequently Asked Questions
What exactly is a memory leak in Chrome?
A memory leak happens when Chrome holds onto memory it no longer needs. This unused memory keeps building up over time. Your Mac slows down because Chrome consumes more and more RAM. Unlike normal memory use that resets when you close tabs, leaks stick around permanently until you restart the browser.
How do I know if Chrome has a memory leak on my Mac?
Open Activity Monitor on your Mac. Click the Memory tab. Watch Chrome’s memory usage while you browse normally. If Chrome’s memory keeps climbing even when you’re not opening new tabs, you likely have a leak. You can also use Chrome DevTools to track memory patterns more precisely.
Does Memory Saver actually fix memory leaks?
Memory Saver reduces memory problems by pausing inactive tabs. This prevents some memory buildup, but it doesn’t fix existing leaks. Think of it as damage prevention rather than a cure. Enable this feature in Chrome settings under Performance to see improvement over time.
Can macOS Sequoia itself cause memory problems that look like Chrome leaks?
Yes, absolutely. The WindowServer process on macOS Sequoia sometimes uses excessive memory. This can make Chrome appear to have leaks when the problem is actually your system. Check Activity Monitor for WindowServer usage. If it’s consuming significant RAM, your Mac needs an update or restart, not Chrome troubleshooting.
What should I do if memory problems continue after trying everything?
Document your findings from both DevTools and Activity Monitor over several days. Note which websites cause the worst problems. Keep Chrome and macOS fully updated. If issues persist, your Mac may need professional evaluation to rule out hardware problems or deeper system conflicts.

Hi, I’m Lily — a tech enthusiast and the voice behind SmartResizerr.com. I love testing gadgets, breaking down specs into plain English, and helping everyday people find the right tech without the overwhelm.